Youtube Top 20 Content Creators
Introduction:
Hello! In this project, I’m breaking down the top content creators on Youtube over 2017-2018. The very first thing i’ll do is load the libraries I’m going to use:
import pandas as pd
import numpy as np
import seaborn as sb
import matplotlib.pyplot as plt
import datetime as dt
import json
from itables import show
%matplotlib inline
Next, I’m reading the data into a .csv:
ytube = pd.read_csv('C:/Users/bruce/Downloads/archive (1)/USvideos.csv')
ytube = pd.DataFrame(ytube)
Afterwards, here’s what everything looks like:
print(ytube.iloc[0:5])
          video_id                                              title  \
3813   NDBwsMIXlMk  Marvel’s Agents of S.H.I.E.L.D. | Season 5 Pre...
3868   NDBwsMIXlMk  Marvel’s Agents of S.H.I.E.L.D. | Season 5 Pre...
3928   NDBwsMIXlMk  Marvel’s Agents of S.H.I.E.L.D. | Season 5 Pre...
3953   6ZfuNTqbHE8  Marvel Studios' Avengers: Infinity War Officia...
3954   KXHrCBkIxQQ  ALL THE MONEY IN THE WORLD - Official Trailer ...
...            ...                                                ...
39536  X2BfTXIwABo                  MARVEL COMICS 2018: A Fresh Start
39541  X2BfTXIwABo                  MARVEL COMICS 2018: A Fresh Start
39546  X2BfTXIwABo                  MARVEL COMICS 2018: A Fresh Start
39551  X2BfTXIwABo                  MARVEL COMICS 2018: A Fresh Start
39556  X2BfTXIwABo                  MARVEL COMICS 2018: A Fresh Start

                     channel_title  category_id    category_title  \
3813          Marvel Entertainment           24     Entertainment
3868          Marvel Entertainment           24     Entertainment
3928          Marvel Entertainment           24     Entertainment
3953          Marvel Entertainment           24     Entertainment
3954   Sony Pictures Entertainment           24     Entertainment
...                            ...          ...               ...
39536         Marvel Entertainment            2  Autos & Vehicles
39541         Marvel Entertainment            2  Autos & Vehicles
39546         Marvel Entertainment            2  Autos & Vehicles
39551         Marvel Entertainment            2  Autos & Vehicles
39556         Marvel Entertainment            2  Autos & Vehicles

             publish_time trending_date     views    likes  dislikes  \
3813  2017-11-26 16:00:21    2017-11-27    248455     7174       200
3868  2017-11-26 16:00:21    2017-11-28    456193     9501       294
3928  2017-11-26 16:00:21    2017-11-29    537443    10577       341
3953  2017-11-29 13:26:24    2017-11-30  37736281  1735895     21969
3954  2017-11-29 20:00:53    2017-11-30    197900     2394       372
...                   ...           ...       ...      ...       ...
39536 2018-02-20 15:00:05    2018-02-24    377995     9315       704
39541 2018-02-20 15:00:05    2018-02-25    385064     9404       712
39546 2018-02-20 15:00:05    2018-02-26    390321     9485       721
39551 2018-02-20 15:00:05    2018-02-27    394864     9560       728
39556 2018-02-20 15:00:05    2018-02-28    400237     9618       732

       comment_count  comments_disabled  ratings_disabled  err_removed
3813            1291              False             False        False
3868            1678              False             False        False
3928            1971              False             False        False
3953          241237              False             False        False
3954             432              False             False        False
...              ...                ...               ...          ...
39536           2367              False             False        False
39541           2391              False             False        False
39546           2419              False             False        False
39551           2436              False             False        False
39556           2447              False             False        False

[640 rows x 14 columns]
Now, i’m going to import categories from the JSON file, flatten, then convert into data frame
with open('C:/Users/bruce/Downloads/archive (1)/US_category_id.json','r') as f:
    ytube_cat = json.loads(f.read())

ytube_cat = (pd.json_normalize(ytube_cat, record_path = 'items')
                .loc[:,['id', 'snippet.title']]
                .rename(columns = {'id':'category_id', 'snippet.title':'category_title'})
            )

ytube_cat = pd.DataFrame(ytube_cat)

print(ytube_cat)
   category_id         category_title
0            1       Film & Animation
1            2       Autos & Vehicles
2           10                  Music
3           15         Pets & Animals
4           17                 Sports
5           18           Short Movies
6           19        Travel & Events
7           20                 Gaming
8           21          Videoblogging
9           22         People & Blogs
10          23                 Comedy
11          24          Entertainment
12          25        News & Politics
13          26          Howto & Style
14          27              Education
15          28   Science & Technology
16          29  Nonprofits & Activism
17          30                 Movies
18          31        Anime/Animation
19          32       Action/Adventure
20          33               Classics
21          34                 Comedy
22          35            Documentary
23          36                  Drama
24          37                 Family
25          38                Foreign
26          39                 Horror
27          40         Sci-Fi/Fantasy
28          41               Thriller
29          42                 Shorts
30          43                  Shows
31          44               Trailers
The merge I want to do to these dataframes isn’t working because the column’s data types do not align, so let’s see if we can change that…
ytube.dtypes
video_id                  object
trending_date             object
title                     object
channel_title             object
category_id                int64
publish_time              object
tags                      object
views                      int64
likes                      int64
dislikes                   int64
comment_count              int64
thumbnail_link            object
comments_disabled           bool
ratings_disabled            bool
video_error_or_removed      bool
description               object
dtype: object
Part 2
ytube_cat.dtypes
category_id       object
category_title    object
dtype: object
ytube_cat['category_id'] = ytube_cat['category_id'].astype('int64')

ytube_cat.dtypes
category_id        int64
category_title    object
dtype: object
I could keep the text based columns (description and tags) if I wanted to do a text analysis; I’ll explore that another time maybe…
# Trimming the fat

ytube = (pd.merge(ytube, ytube_cat)
           .rename(columns = {'video_error_or_removed':'err_removed'})
           .loc[:,['video_id', 'title', 'channel_title', 'category_id', 'category_title', 'publish_time', 'trending_date',
                  'views', 'likes', 'dislikes', 'comment_count', 'comments_disabled', 'ratings_disabled', 'err_removed']]
        )

print(ytube.iloc[0:5])
      video_id                                              title  \
0  NDBwsMIXlMk  Marvel’s Agents of S.H.I.E.L.D. | Season 5 Pre...
1  NDBwsMIXlMk  Marvel’s Agents of S.H.I.E.L.D. | Season 5 Pre...
2  NDBwsMIXlMk  Marvel’s Agents of S.H.I.E.L.D. | Season 5 Pre...
3  6ZfuNTqbHE8  Marvel Studios' Avengers: Infinity War Officia...
4  KXHrCBkIxQQ  ALL THE MONEY IN THE WORLD - Official Trailer ...

                 channel_title  category_id category_title  \
0         Marvel Entertainment           24  Entertainment
1         Marvel Entertainment           24  Entertainment
2         Marvel Entertainment           24  Entertainment
3         Marvel Entertainment           24  Entertainment
4  Sony Pictures Entertainment           24  Entertainment

         publish_time trending_date     views    likes  dislikes  \
0 2017-11-26 16:00:21    2017-11-27    248455     7174       200
1 2017-11-26 16:00:21    2017-11-28    456193     9501       294
2 2017-11-26 16:00:21    2017-11-29    537443    10577       341
3 2017-11-29 13:26:24    2017-11-30  37736281  1735895     21969
4 2017-11-29 20:00:53    2017-11-30    197900     2394       372

   comment_count  comments_disabled  ratings_disabled  err_removed
0           1291              False             False        False
1           1678              False             False        False
2           1971              False             False        False
3         241237              False             False        False
4            432              False             False        False
#Change date format for trending dates

ytube['trending_date'] = pd.to_datetime(ytube['trending_date'], format='%y.%d.%m')
print(ytube['trending_date'])
0       2017-11-14
1       2017-11-14
2       2017-11-14
3       2017-11-14
4       2017-11-14
           ...
40944   2018-06-02
40945   2018-06-03
40946   2018-06-04
40947   2018-06-05
40948   2018-06-06
Name: trending_date, Length: 40949, dtype: datetime64[ns]
Now that everything is pretty much formatted and cleaned, i’m going to plot the only the necessary data.
# Specify the kind of plot st
plt.style.use('default')
# Convert 'publish_time' column to datetime
ytube['publish_time'] = (pd.to_datetime(ytube['publish_time'])
.dt.tz_localize(None)
)
# Filter out the ytube for the years 2017 and 2018
ytube = ytube[(ytube['publish_time'].dt.year >= 2017) & (ytube['publish_time'].dt.year <= 2018)]
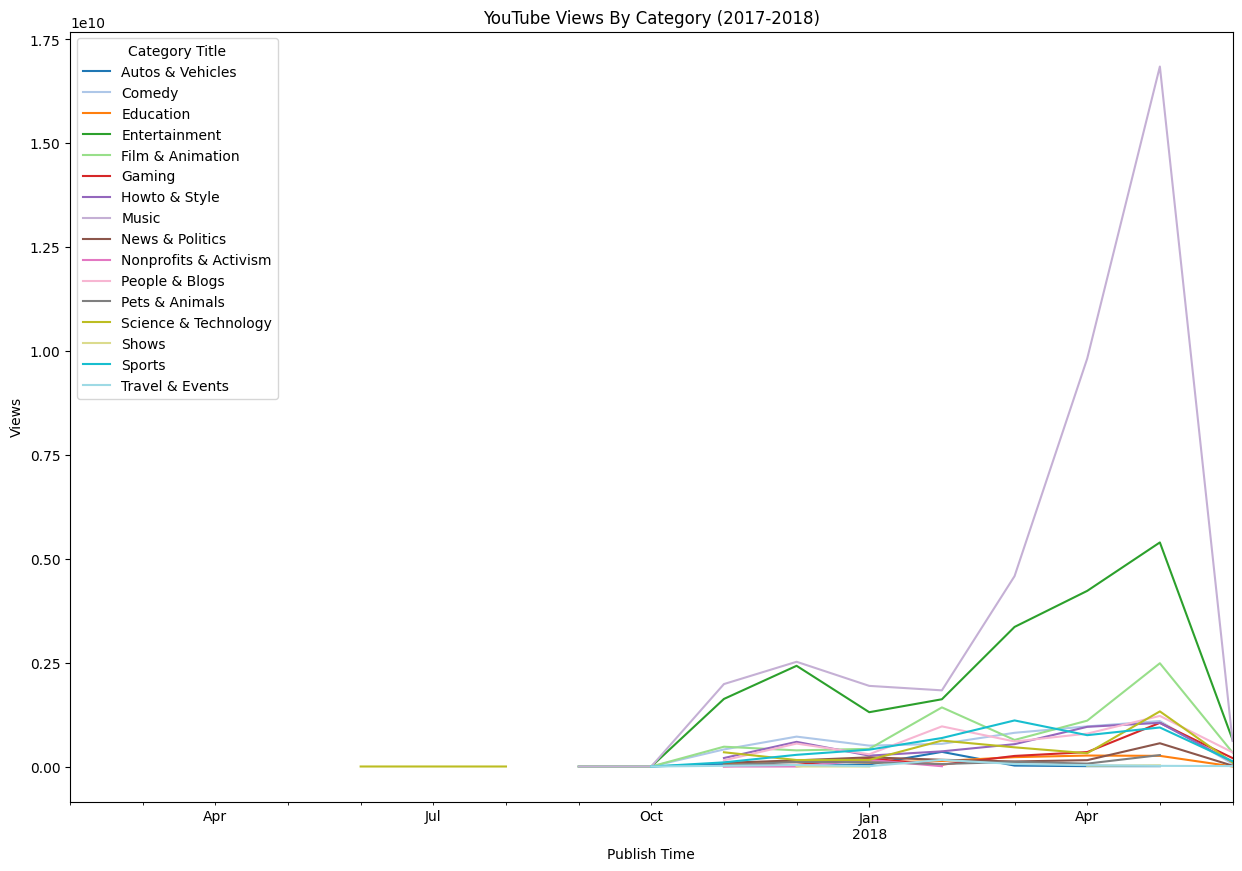
# Group the ytube by 'category_title' and 'publish_date' (by year and month), then sum up the 'views'
ytube_grouped = ytube.groupby([ytube['category_title'], ytube['publish_time'].dt.to_period('M')])['views'].sum().reset_index()
# Pivot the ytube to have 'category_title' as columns and dates as index
ytube_pivoted = ytube_grouped.pivot(index='publish_time', columns='category_title', values='views')
# Plot the time series of each category
ax = ytube_pivoted.plot(kind='line', figsize=(15, 10), colormap = 'tab20')
plt.title('YouTube Views By Category (2017-2018)')
plt.xlabel('Publish Time')
plt.ylabel('Views')
# Change legend title:
legend = ax.legend()
legend.set_title('Category Title')
plt.show()
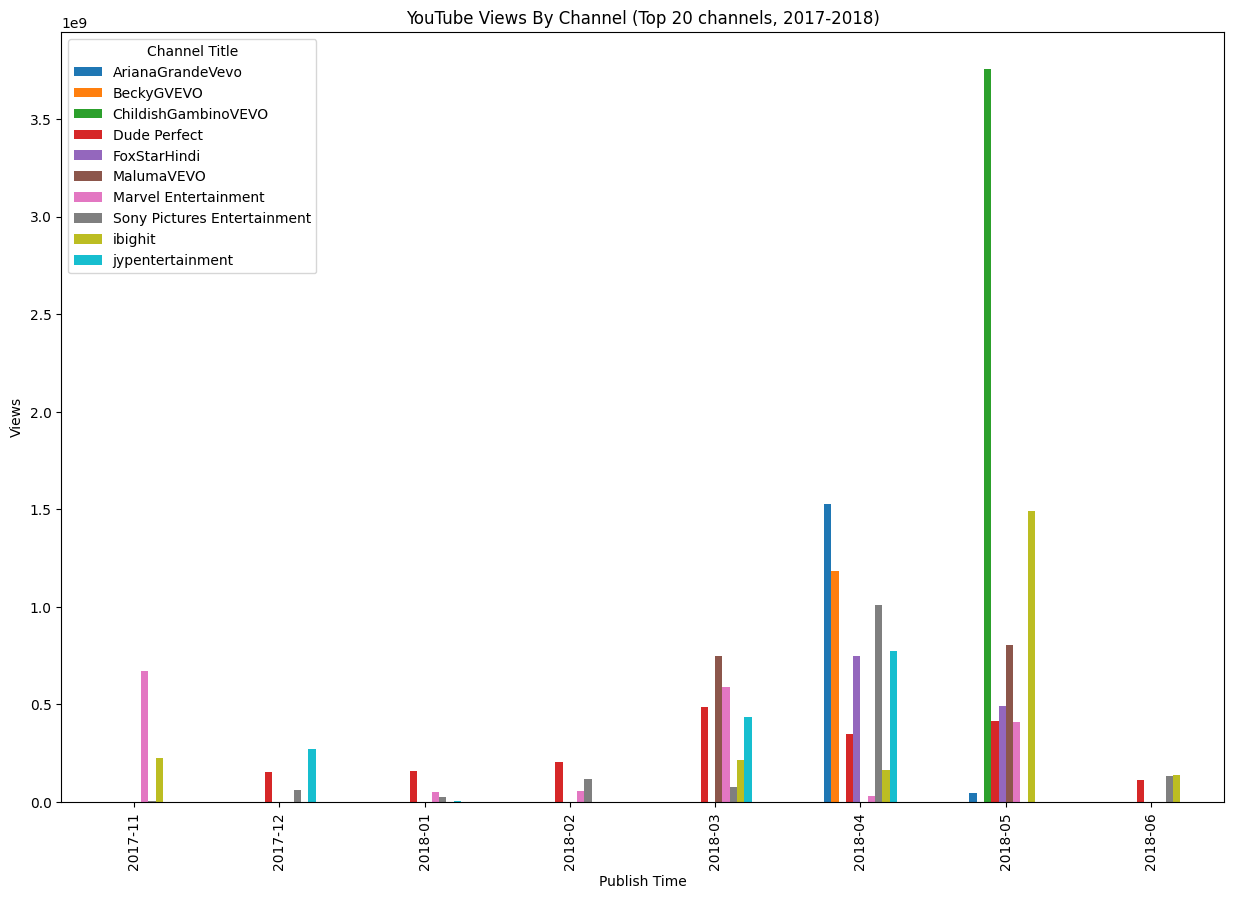
# Group the ytube by 'category_title' and 'publish_date' (by year and month), then sum up the 'views'
ytube_grouped = ytube.groupby([ytube['channel_title'], ytube['trending_date'].dt.to_period('M')])['views'].sum().reset_index()

# Get top 10 channels by total views
top_channels = ytube.groupby('channel_title')['views'].sum().nlargest(10).index

# Filter the data to include only the top 10 channels
ytube = ytube[ytube['channel_title'].isin(top_channels)]

# Group the ytube by 'channel_title' and 'publish_date' (by year and month), then sum up the 'views'
ytube_grouped = ytube.groupby([ytube['channel_title'], ytube['publish_time'].dt.to_period('M')])['views'].sum().reset_index()

# Pivot the data to have 'channel_title' as columns and dates as index
ytube_pivoted = ytube_grouped.pivot(index='publish_time', columns='channel_title', values='views')

# Plot the time series of each channel
ax = ytube_pivoted.plot(kind='bar', figsize=(15, 10))

# Change legend title:
legend = ax.legend()
legend.set_title('Channel Title')

plt.title('YouTube Views By Channel (Top 20 channels, 2017-2018)')
plt.xlabel('Publish Time')
plt.ylabel('Views')
plt.show()
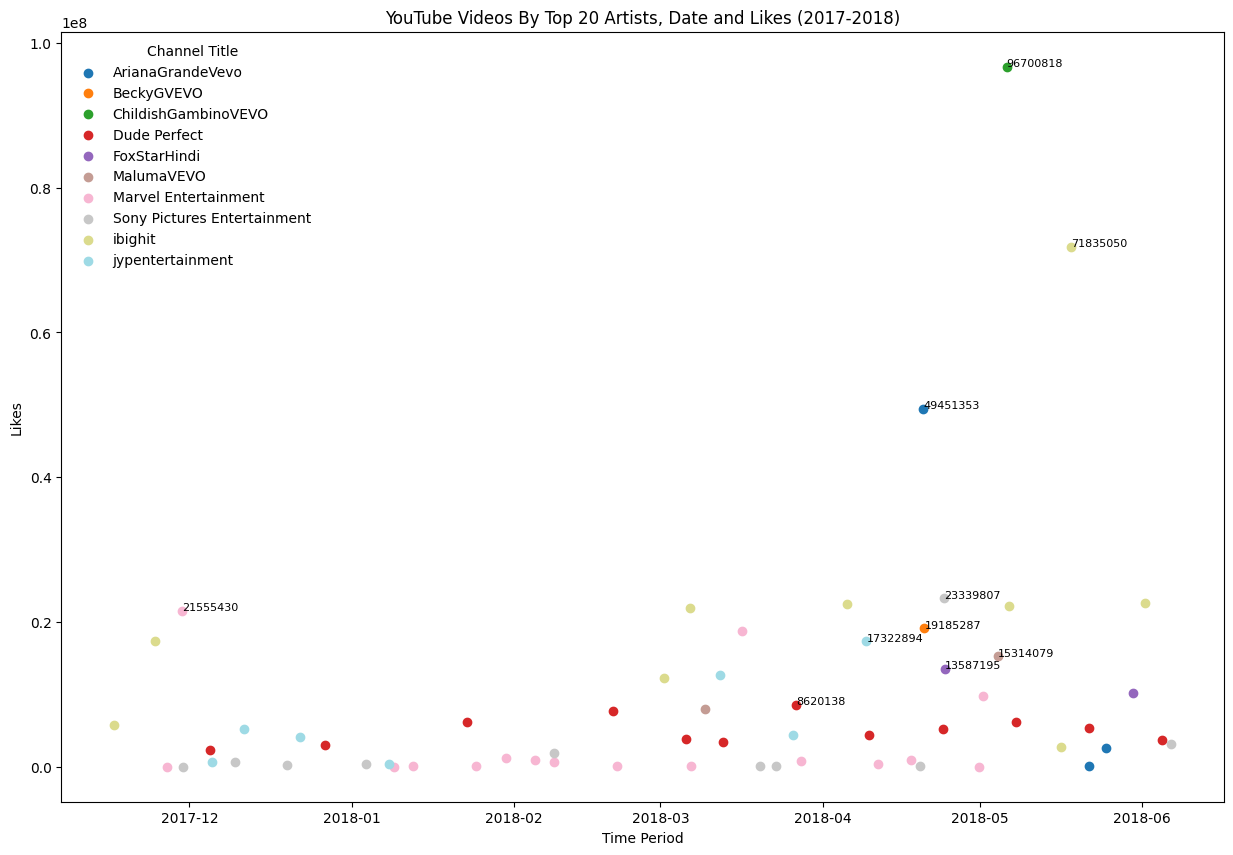
# Group the ytube by 'category_title' and 'publish_date' (by year and month), then sum up the 'views'
ytube_grouped = (ytube.groupby([ytube['channel_title'], ytube['likes'], ytube['dislikes']])['views']
                     .sum()
                     .reset_index())

# Get top 20 channels by total views
top_channels = (ytube.groupby('channel_title')['views']
                    .sum()
                    .nlargest(20)
                    .index)

# Filter the data to include only the top 20 channels
ytube = ytube[ytube['channel_title'].isin(top_channels)]

# Group the data by 'channel_title' and 'publish_date' (by year and month), then sum up the 'views'
ytube_grouped = (ytube.groupby([ytube['channel_title'], ytube['publish_time']])['likes']
                      .sum()
                      .reset_index())

# Pivot the data to have 'channel_title' as columns and dates as index
ytube_pivoted = ytube_grouped.pivot(index='publish_time', columns='channel_title', values='likes')

# Create a scatter plot for each category
fig, ax = plt.subplots(figsize=(15, 10))

# Specify colormap
cmap = plt.get_cmap('tab20')  # Colormap with 20 different colors
colors = cmap(np.linspace(0, 1, len(ytube_pivoted.columns)))

for i, column in enumerate(ytube_pivoted):
    ax.scatter(ytube_pivoted.index, ytube_pivoted[column], label=column, color=colors[i])

    # Find the maximum value for each channel and label it
    max_val_index = ytube_pivoted[column].idxmax()
    max_val = ytube_pivoted.loc[max_val_index, column]

    ax.text(max_val_index, max_val, f'{max_val:.0f}', fontsize=8)


plt.title('YouTube Videos By Top 20 Artists, Date and Likes (2017-2018)')
plt.xlabel('Time Period')
plt.ylabel('Likes')


legend = ax.legend(frameon = False)
legend.set_title("Channel Title")

plt.show()